Analyzing Networks
Weights and Projection panels, accessible through the View menu, and Analyzer, accessible from the Tools menu, can be used for getting insight into a network. All the panels correspond to their SNNS counterparts and differ only in appearance.
Projection Panel
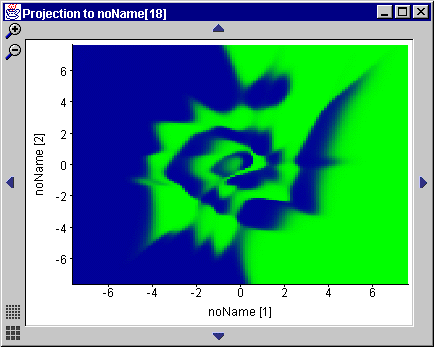
The Projection panel shows activation of a hidden or output unit as a function of activations of two input units. The panel can only be opened when the three units are selected in a network view. The activations of the input units are drawn on the x- and y-axis, while corresponding activations of the output unit are represented by different pixel colors. For the chroma coding, the same values as for the network view apply.
Arrows at the panel edges are used for moving the projection window in the input space. The two buttons on in the top left corner are used for zooming, and the buttons in the bottom left corner for adjusting the view resolution. Zooming can also be performed manually, by dragging a rectangle in the projection area.

Figure 13: Projection panel
Weights Panel
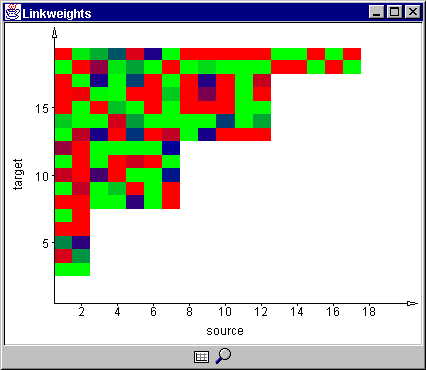
The Weights panel presents link weights as colored rectangles. The x-axis is used for source units and the y-axis for the target units of the links. The two buttons at the panel bottom are used for toggling grid and for auto zoom for optimal display. As in the projection panel, zooming can be performed manually.

Figure 14: Weights panel
Analyzer
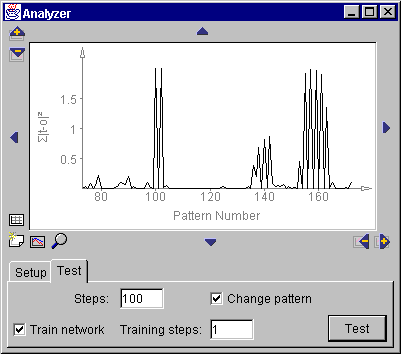
The Analyzer is used to show output or activation of a unit as a function of other unit's activation or of the input pattern. Its usage is similar to the Analyze panel in the SNNS. The control buttons are also familiar and have the same function as in the Error Graph, Projection and Weights panel.

Figure 15: Analyzer panel
Last change:
Igor Fischer, Thu May 16 14:13:36 2002 GMT
Page 9: JavaNNS-manual-8.html
 © 2001-2002 Universität Tübingen © 2001-2002 Universität Tübingen
| 